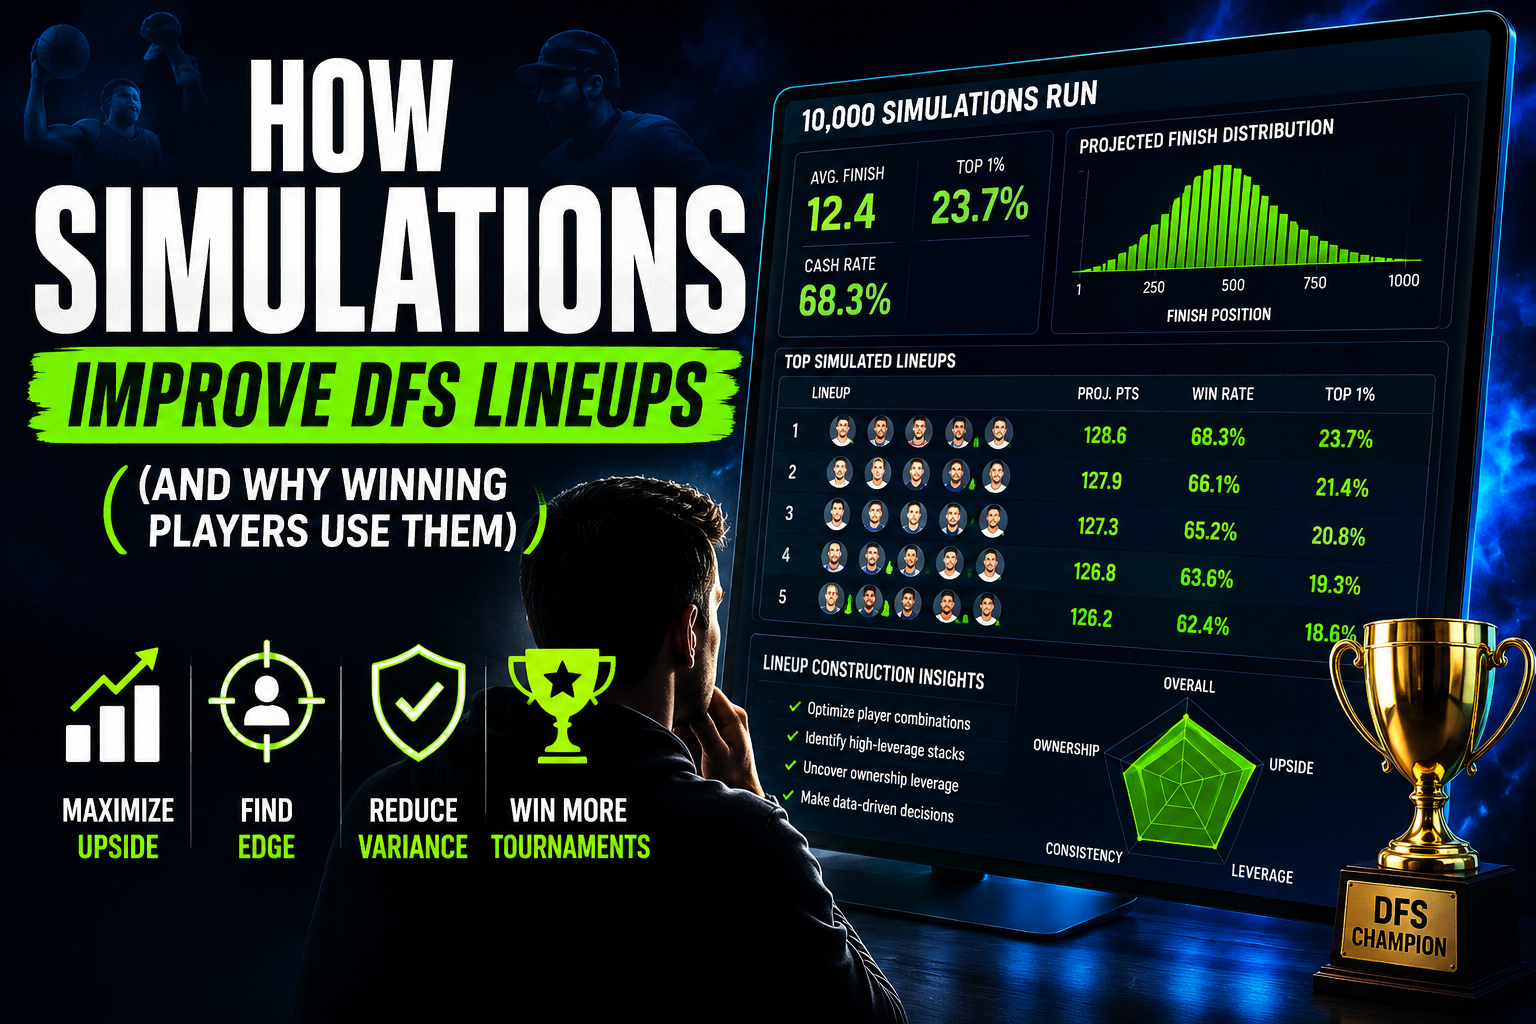
You set the perfect lineup. Your value play smashes, your chalk play busts, and you still miss the cash line by half a point. That’s usually the moment a DFS player starts looking into simulations, because gut feel and a spreadsheet of projections only get you so far before variance starts making the decisions for you.
DFS sims don’t try to guess who scores the most points. They run your lineup, and every reasonable alternative to it, through thousands of possible versions of the same slate to show you what actually tends to happen across all of them. That’s a different kind of information than a projection, and it changes how sharp players build both cash lineups and tournament rosters.
Here’s how simulations actually work, what they catch that a plain projection can’t, and where they still leave room for your own judgment.
What Are DFS Simulations?
Quick answer: A DFS simulation is a model that plays out a slate thousands of times using randomized, realistic outcomes for every player, then measures how often your lineup wins, cashes, or busts across all of those outcomes.
Instead of giving you one number for a player, like 18.4 projected points, a simulation gives you a range of outcomes built around that projection, weighted by how volatile that player actually is. A running back in a stable, high-floor role gets a tighter range. A boom-or-bust wide receiver in a pass-heavy game script gets a wider one. Run that logic across every player on the slate at once, thousands of times over, and you get a lineup-level picture instead of a player-level guess.
That output usually comes back as a set of percentages: your projected finish in the field, your odds of cashing in a specific contest, your odds of taking down a large-field tournament outright. It’s the difference between “this player should score well” and “this lineup wins about 4% of the time in a 50,000-entry GPP.”
See what one of our users has to say about our sims tool:
Lineups, Not Players
If you’re reading this, you’ve certainly read a fair amount of DFS content before. For the most part, that content is the same. “Here’s why this player will smash!” “Here’s why I’m fading this guy!”
That’s all well and good. There’s a place for it. Of course, player-level takes are one thing, but you don’t win GPPs with players. Lineups are what matter, not the individual players. You can nail every individual call…and still lose. Play the highest-owned QB because he projects the best. Pair him with the receiver everyone agrees is a smash. Mix in the running back with the safest floor. Every decision you made building your lineup is defensible on its own, and you still wound up with the same lineup as 30,000 other entries, because everyone made the same “correct” decisions that you did.
That, of course, is the trap. Player-level content grades players. It doesn’t grade the 9 of them lining up on your roster together. A running back who looks unremarkable on his own can be the piece that unlocks a stack, because his game script correlates with your QB’s passing volume in a way no single-player take would mention. Nobody’s writing “fade this guy” articles about lineup construction, because lineup construction isn’t about any one player.
That’s really the whole case for a simulator. Player takes are fine for building your pool. But the second you start asking which names belong in a lineup together, you’ve left the player-level thinking behind. That’s a different problem, and, sometimes, it needs a different tool.
How DFS Sims Actually Work
Most DFS simulation tools are built on a method called Monte Carlo simulation, which just means running the same scenario over and over with slightly different random inputs each time, then looking at the full spread of results instead of a single average.
Here’s the basic sequence a simulator runs through:
- Build a distribution for every player, not just a projection. This accounts for usage, matchup, game script, and how consistent or volatile that player’s role tends to be.
- Simulate the slate thousands of times. Each simulation randomly draws an outcome for every player based on their distribution, then adds up the scores for every possible lineup combination.
- Layer in ownership and contest structure. The tool factors in projected ownership for every player and the actual payout structure of your contest, cash game or GPP, single entry or mass multi-entry.
- Aggregate the results. After thousands of simulated slates, the tool reports how your lineup performed on average, plus how often it cashed, how often it finished in the top 1%, and how it compares to thousands of other lineup combinations.
The result isn’t a prediction of what will happen. It’s a map of what’s likely to happen, and how often, across every realistic version of that Sunday, that slate, that tournament.
Why Simulations Beat Gut Feel and Simple Projections
Simulations outperform gut feel and flat projections because they account for correlation and variance, two things a single projected point total can’t capture on its own. A projection tells you what a player is expected to score in isolation. A simulation tells you what your entire lineup tends to do when every player’s outcome is allowed to move independently, the way it actually would on game day.
Gut feel has an even bigger blind spot. It’s shaped by whichever game you watched most recently, whichever player just had a big week, and whichever narrative is loudest on social media that day.
Simulations don’t have a memory of last week’s box score. They just run the math on this week’s matchups, usage, and role.
| Traditional Projections | DFS Simulations | |
|---|---|---|
| Output | Single point total per player | Full range of outcomes per player |
| Correlation | Ignored | Built in (stacks, game scripts) |
| Contest fit | Not contest-specific | Adjusts for cash vs. GPP structure |
| Best use | Quick, single-player checks | Full lineup construction and comparison |
Neither tool is useless on its own. But a projection tells you what a player might do, while a simulation tells you what your lineup is actually likely to do, which is the number that determines whether you cash.
What Simulations Measure That Humans Can’t
Simulations measure two things no player can track by hand: correlation across an entire lineup and win probability across a specific field size. A human can eyeball two players and guess they’re correlated, like a quarterback and his top receiver. A simulation actually quantifies it, running out how often that stack’s combined outcome beats the field compared to two uncorrelated players with the same combined projection.
Field size matters more than most players give it credit for. A lineup built to win a 10-person cash game and a lineup built to win a 100,000-person GPP need completely different construction, because the math behind “most likely to cash” and “most likely to take down a massive tournament” isn’t the same math. Simulations run that comparison instantly. A human staring at a spreadsheet, even a good one, is estimating.
The Biggest Benefits of Using DFS Simulations
Quick answer: DFS simulations are worth using because they replace guesswork with probability, showing you not just who might score well but how your entire lineup performs across thousands of realistic outcomes, tailored to your specific contest type.
The clearest benefit is confidence grounded in math instead of a hunch. You’re not asking “does this lineup feel right.” You’re looking at an actual cash rate, an actual duplication risk, an actual ceiling outcome, and deciding from there.
The second benefit is speed. Testing ten different lineup builds by hand, thinking through every correlation and ownership scenario yourself, takes hours. A simulator runs that same comparison in seconds and hands you a ranked list.
The third benefit is catching blind spots. Simulations regularly surface a lineup construction a player wouldn’t have considered on their own, because the math doesn’t care about which player “feels” like the safe pick.
How Simulations Improve Cash Game Lineups
Simulations improve cash game lineups by prioritizing floor and consistency over ceiling, which is exactly what a 50/50 or double-up contest actually rewards. Cash games don’t pay out for finishing first. They pay out for finishing in the top half, so a simulator weighs a player’s most likely outcome far more heavily than their best-case outcome.
That shifts lineup construction in a specific direction. A running back with a locked-in workload and low touchdown dependency often simulates better for cash than a boom-or-bust receiver with a higher ceiling but a wider range of bad outcomes. The simulation isn’t guessing which player “feels safer.” It’s showing you which player actually clears the cash line more consistently across thousands of simulated slates.
How Simulations Improve Tournament (GPP) Lineups
Simulations improve GPP lineups by optimizing for ceiling and uniqueness instead of floor, since large-field tournaments only pay real money near the very top. A lineup that cashes 40% of the time but never finishes first is a good cash game lineup and a mediocre GPP lineup, and a simulator will show you that gap directly instead of leaving you to guess.
This is where correlation really starts to matter. A simulator can show you that a specific quarterback-receiver stack, paired with a bring-back from the opposing team, produces a meaningfully higher rate of top-1% finishes than three individually strong but uncorrelated players. No projections sheet shows you that on its own. It only shows up once you simulate the actual combined outcome thousands of times.
Using Simulations to Find Leverage Plays
Simulations help you find leverage plays by comparing a player’s simulated win rate to their projected ownership, so you can spot players who are good but under-rostered relative to how often they actually help you win. A leverage play isn’t just a sleeper. It’s a player whose true win contribution is higher than the field currently believes.
Say a tight end is projected at 8% ownership but simulates into the winning lineup in 14% of outcomes. That gap is the leverage. Rostering that player differentiates you from most of the field while still being backed by real math, not just a contrarian instinct. Simulations are what let you find that gap instead of stumbling into it by accident.
How Simulations Help Identify the Best DFS Stacks
Simulations identify strong stacks by testing how players perform together across thousands of outcomes, rather than just adding up their individual projections. Two players who each project well on their own don’t automatically make a good stack. What matters is whether their good games tend to happen on the same slate.
A quarterback and his top target are the most obvious correlated pair, since one player’s big passing game usually means the other is catching the ball. But simulations also surface less obvious stacks, like a running back and a defense in a game script where one team is expected to control the clock late, something that’s much harder to spot just by scanning individual projections.
Simulations and Ownership Projections: Why They Work Better Together
Simulations and ownership projections work best together because raw simulated win rate only tells you half the story, and ownership tells you the other half, how much of the field is already rostering that same outcome. A player who simulates well but is also going to be in 40% of lineups doesn’t separate you from the field even if they hit.
Pairing the two numbers is what actually drives smart GPP decisions. A player with a strong simulated win rate and low projected ownership is a real edge. A player with the same win rate and sky-high ownership is a name you might still play, but it won’t be the difference-maker your lineup needs to stand out in a massive field.
Common Mistakes Players Make When Using Simulations
The most common mistake is treating a simulation’s output as a guarantee instead of a probability. A lineup that wins 6% of the time in simulation is still going to lose 94% of the time, and players who forget that get frustrated after a single bad week and stop trusting a tool that was actually working exactly as designed.
The second common mistake is ignoring contest format. Running cash-game-optimized lineups into a GPP, or vice versa, throws away most of the benefit a simulation provides, since the two formats are optimizing for completely different outcomes.
The third mistake is skipping the human layer entirely. Injury news, weather, and last-minute inactives change a slate faster than any simulation refreshes, and a player who blindly trusts an outdated simulation over a breaking news alert is going to get burned.
When Simulations Can Be Wrong (And How to Account for It)
Simulations can be wrong when the inputs feeding them are wrong, since a model is only as good as the projections, usage assumptions, and game scripts built into it. Bad input data produces a confident-looking, precisely-worded output that’s still built on a shaky foundation.
Expert summary: Trust simulations for lineup construction, correlation, and contest-specific strategy, since that’s math a human genuinely can’t replicate by hand. Trust your own research for breaking news, that day’s weather, and any last-minute inactive, since a simulation is only ever as current as the data someone fed into it before kickoff.
The players who get burned by simulations usually aren’t using bad tools. They’re using good tools without double-checking the assumptions those tools were built on that week.
How Professional DFS Players Use Simulations
Professional DFS players use simulations as one input in a larger process, not as the entire process. Most pros run simulations early in their process to build a pool of strong lineup candidates, then apply their own research, breaking news, and contest-specific instincts on top of that pool before finalizing anything.
The pattern that separates a pro from a casual player usually isn’t access to a better simulator. It’s discipline. Pros run the same tool a recreational player might have access to, but they treat the output as a starting point for further filtering rather than a finished answer, and they update their inputs constantly as news breaks throughout the day.
What to Look for in a DFS Simulation Tool
The most important thing to look for in a DFS simulation tool is transparency in how it builds player distributions, since a tool that just spits out a win percentage with no visibility into usage assumptions or game script logic is hard to trust when its output disagrees with your own read on a slate.
Simulators and lineup optimizers often get bundled into the same product, but they’re solving different problems.
| Simulators | Optimizers | |
|---|---|---|
| What it does | Models thousands of possible outcomes | Builds the mathematically “best” lineup from your projections |
| Output | Win rate, cash rate, range of outcomes | A single optimal lineup (or a set of lineups) |
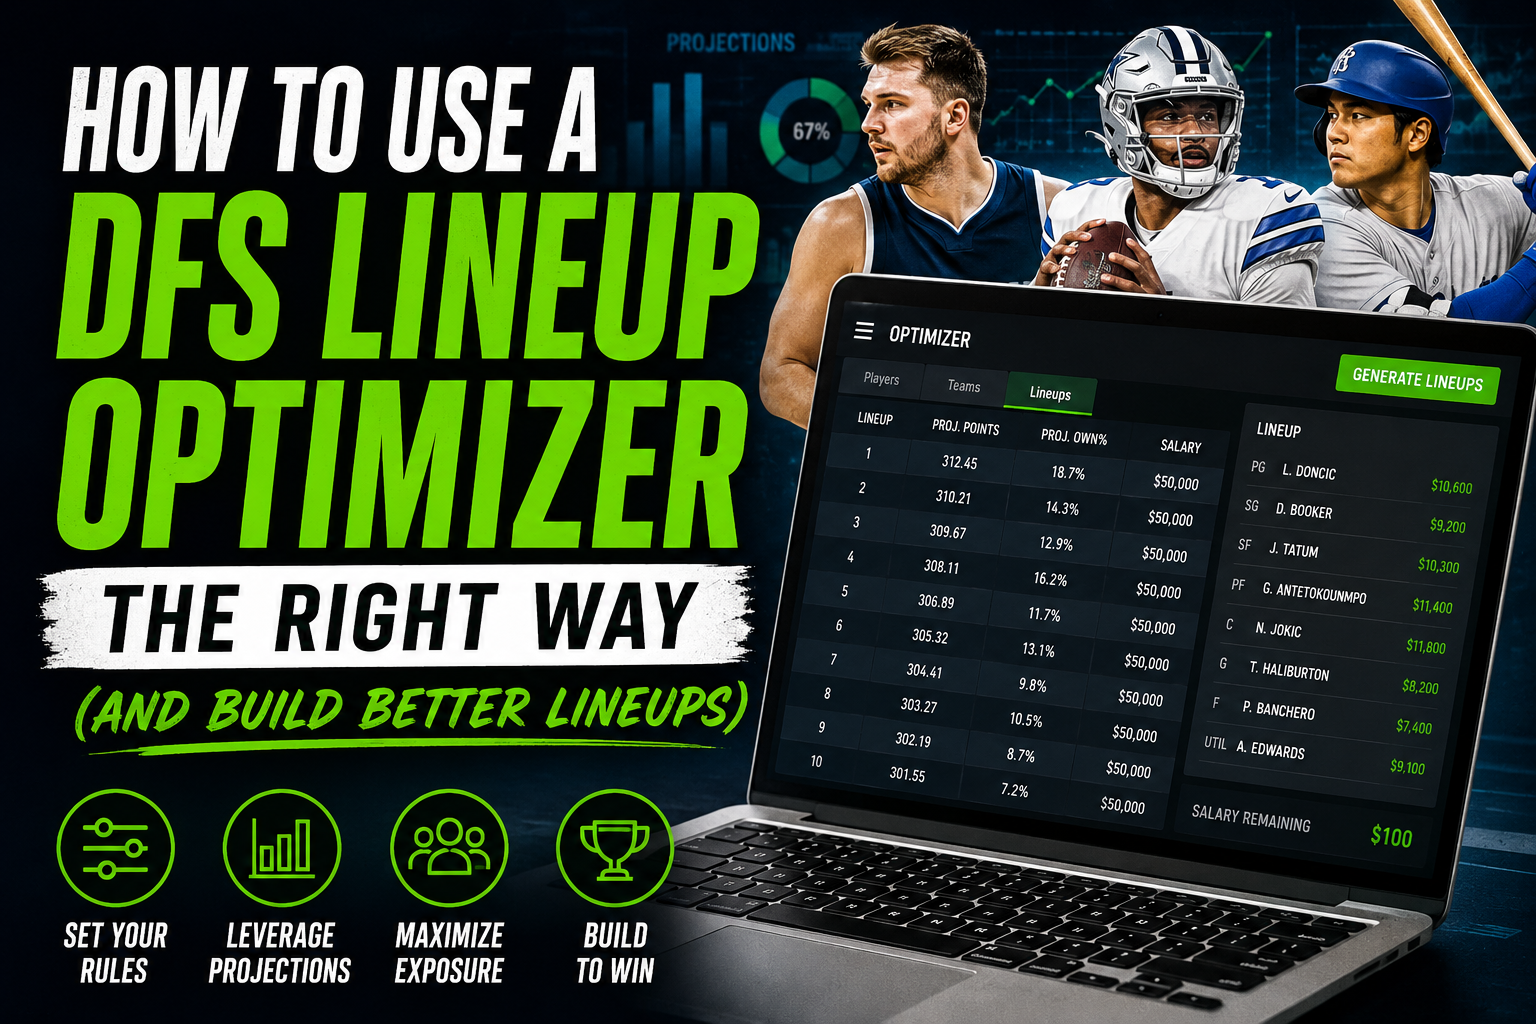
| Best for | Understanding risk and correlation | Quickly generating lineups from existing projections |
| Limitation | Only as good as its inputs | Only as good as the projections you feed it, with no built-in variance |
A strong tool usually offers both, letting you simulate first to understand the landscape, then optimize within the boundaries the simulation revealed.
Frequently Asked Questions
DFS simulations are models that play out a slate thousands of times using realistic, randomized outcomes for every player, then report how often a given lineup wins, cashes, or busts across all those outcomes.
They’re as accurate as the assumptions built into them. The math itself is sound, but a simulation built on outdated usage rates or a bad game script assumption will produce a confident, precise number that’s still wrong.
Yes, most pros run simulations early in their process to build a pool of strong lineups, then layer their own research and late-breaking news on top before finalizing anything.
They answer different questions. Projections estimate what a single player might score. Sims estimate what your entire lineup is likely to do across thousands of outcomes, which is the number that really determines whether you cash or win.
Yes! Mainly by surfacing correlated stacks and leverage plays that are underpriced relative to their true win rate, which is exactly the kind of edge that separates a top-1% finish from a min-cash.
Key Takeaways
DFS simulations replace gut feel and single-number projections with a full range of outcomes for your lineup, run thousands of times against realistic, correlated scenarios. They reward floor and consistency for cash games, ceiling and correlation for GPPs, and they’re the clearest way to spot leverage plays the rest of the field is underpricing. They’re not a guarantee, and they’re only as good as the data feeding them, but paired with your own research on injuries, weather, and late news, they’re the closest thing DFS has to an actual edge.
Want to try a tool that combines projections and sims and doesn’t cost an arm and a leg? Give ours a try:

Noah Simpson is a New England-based DFS writer who has spent the better part of a decade obsessing over MLB DFS. He got his start playing DFS recreationally before realizing he was spending more time building spreadsheets than actually watching games, and decided to make it official. At DFSBuild, Noah covers MLB DFS strategy with a focus on finding edges that casual players overlook. When he’s not staring at Statcast data, he’s somewhere on a hiking trail in Maine with his two dogs, Sandboy and Johnner, who are undefeated at ignoring his lineup advice, because they are dogs. They don’t have the cognitive or motor skills required to operate a computer, let alone process complex theories and information.
Want more winning DFS plays like this? Get our daily core plays, leverage spots, and strategy sent straight to your inbox.










Leave a Reply